JARRSTEC contributes advanced visualization skills, real-time simulation, and data optimization that can revolutionize how an electric company operates and communicates its projects.
Digital Twins and Immersion
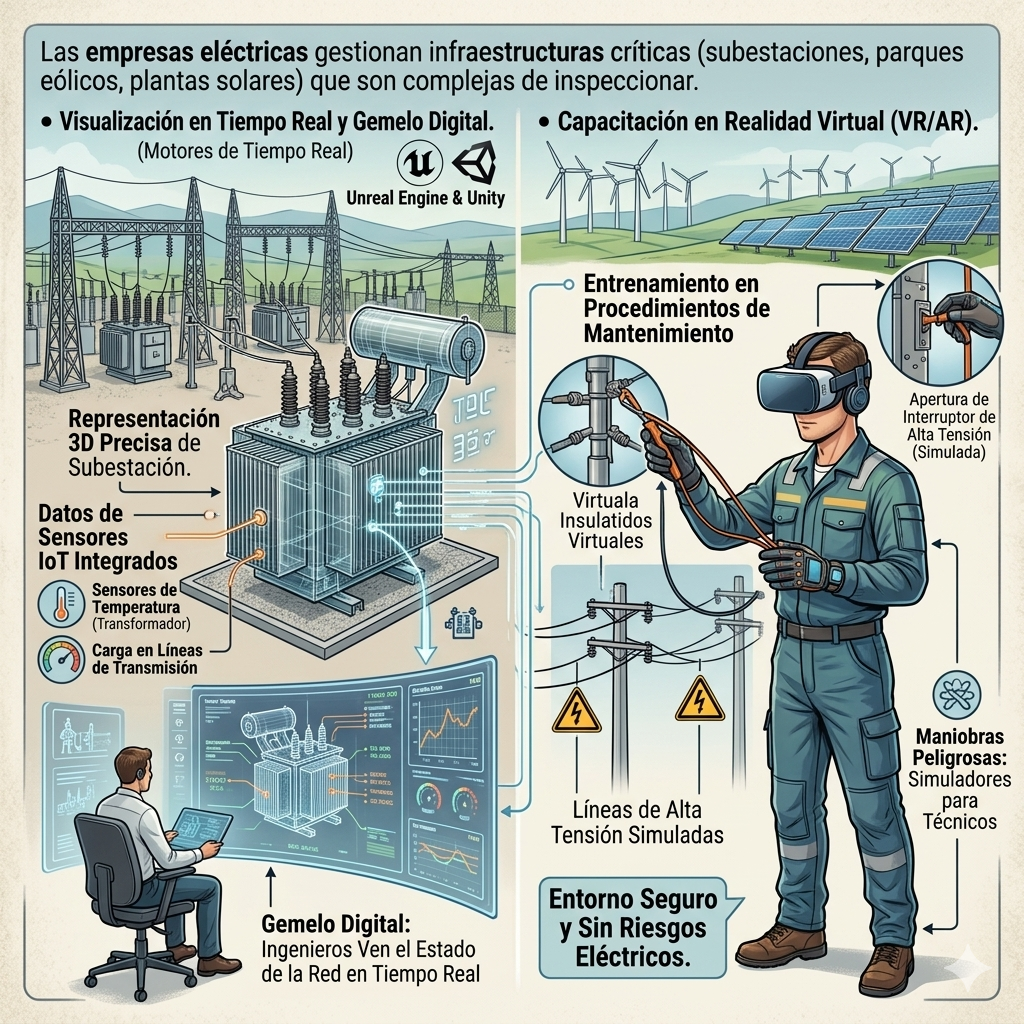
Electricity companies manage critical infrastructure (substations, wind farms, solar plants) that are complex to inspect.
Real-Time Visualization: You can use engines like Unreal Engine or Unity to create accurate 3D representations of a substation. By integrating IoT sensor data (temperature sensors on transformers, load on transmission lines), you can create a Digital Twin where electrical engineers can view the status of the network in real time in a virtual environment.
Virtual Reality (VR/AR) Training: Design simulators for technicians to train maintenance procedures on high-voltage lines or dangerous maneuvers in a safe environment without electrical risks.
Location Optimization (Spatial Simulation)
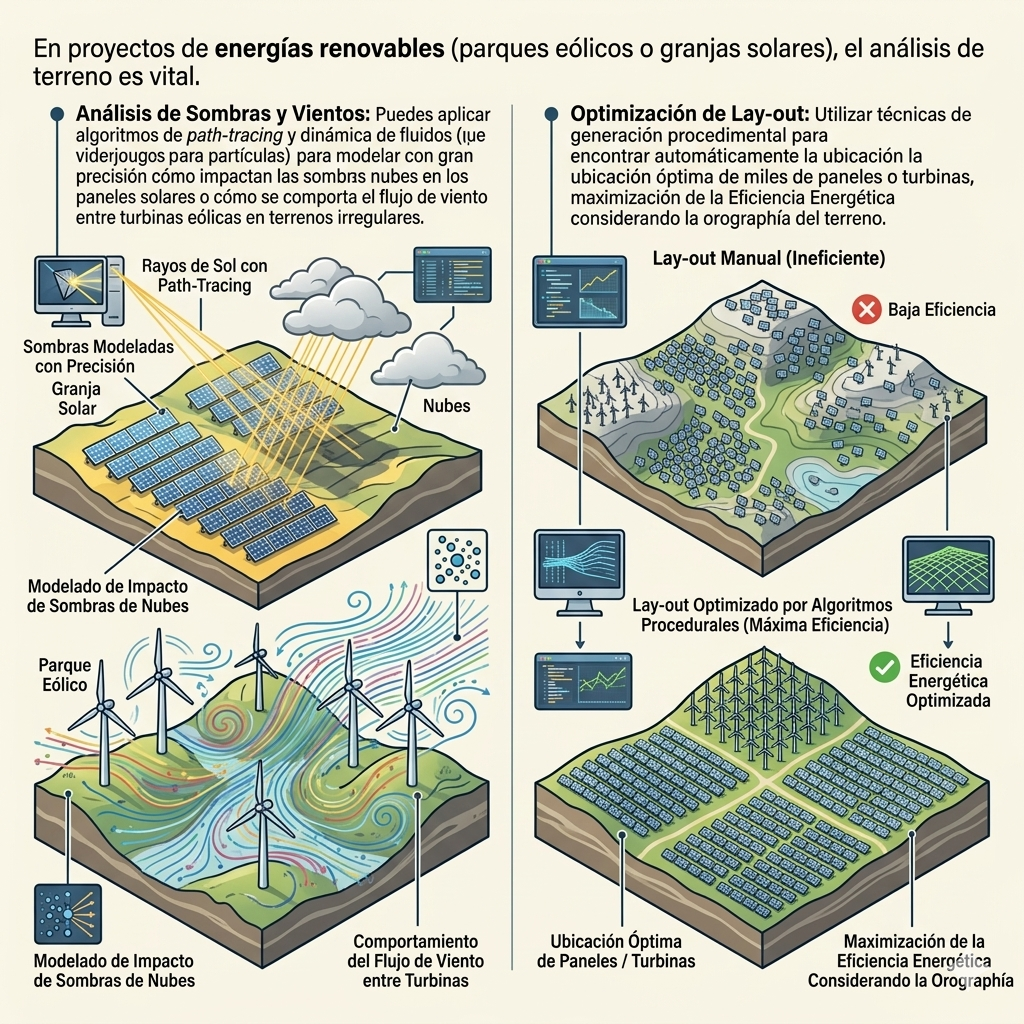
In renewable energy projects (wind farms or solar farms), terrain analysis is vital.
Analysis of Shadows and Winds: You can apply algorithms to path-tracing and fluid dynamics (which are used in video games for particle effects) to model with great precision how cloud shadows impact solar panels or how wind flow behaves between wind turbines on uneven terrain.
Layout Optimization: Use procedural generation techniques to automatically find the optimal location of thousands of panels or turbines, maximizing energy efficiency while considering the terrain's topography.
User Interface and User Experience (UI/UX) for Engineering Software
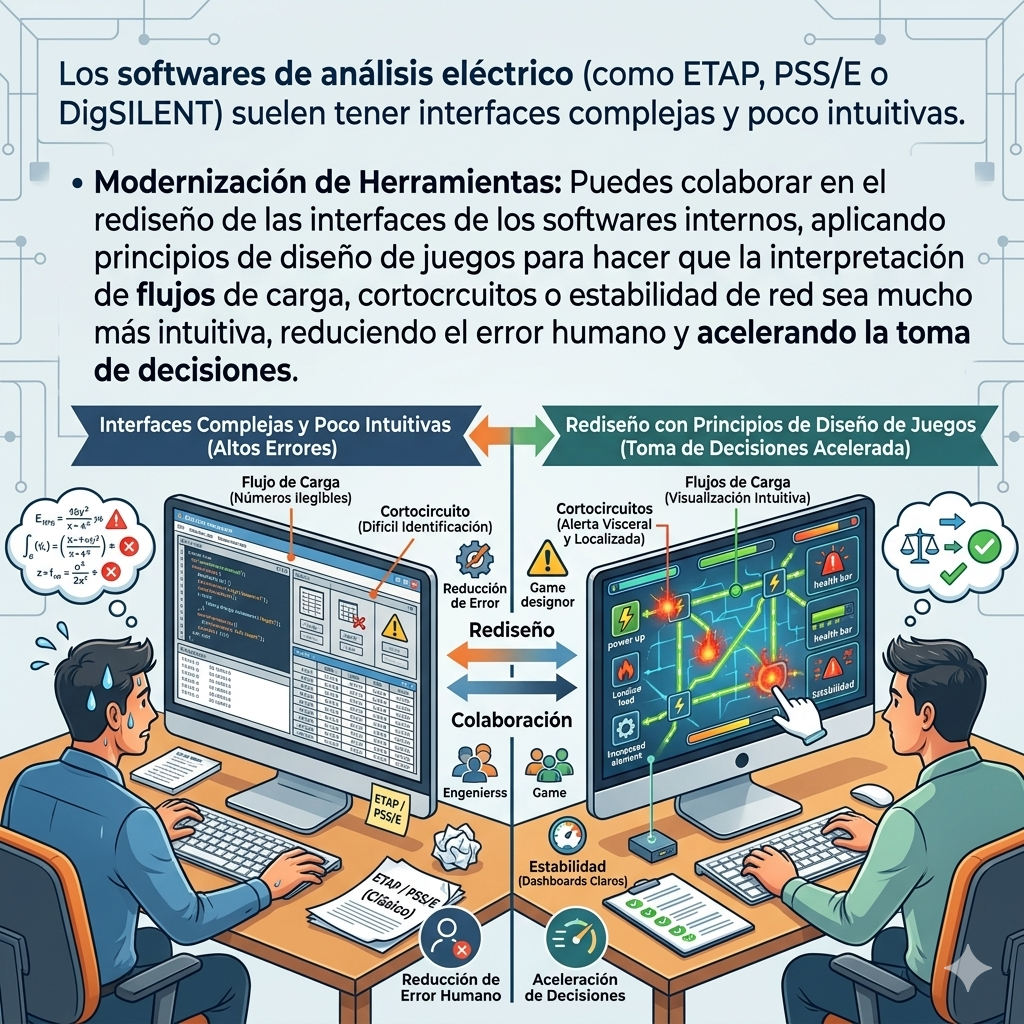
Electrical analysis software (such as ETAP, PSS/E or DigSILENT) often has complex and unintuitive interfaces.
Tool Modernization: You can collaborate on redesigning the interfaces of internal software, applying game design principles to make the interpretation of load flows, short circuits, or network stability much more intuitive, reducing human error and accelerating decision-making.
Visualizing Complex Data
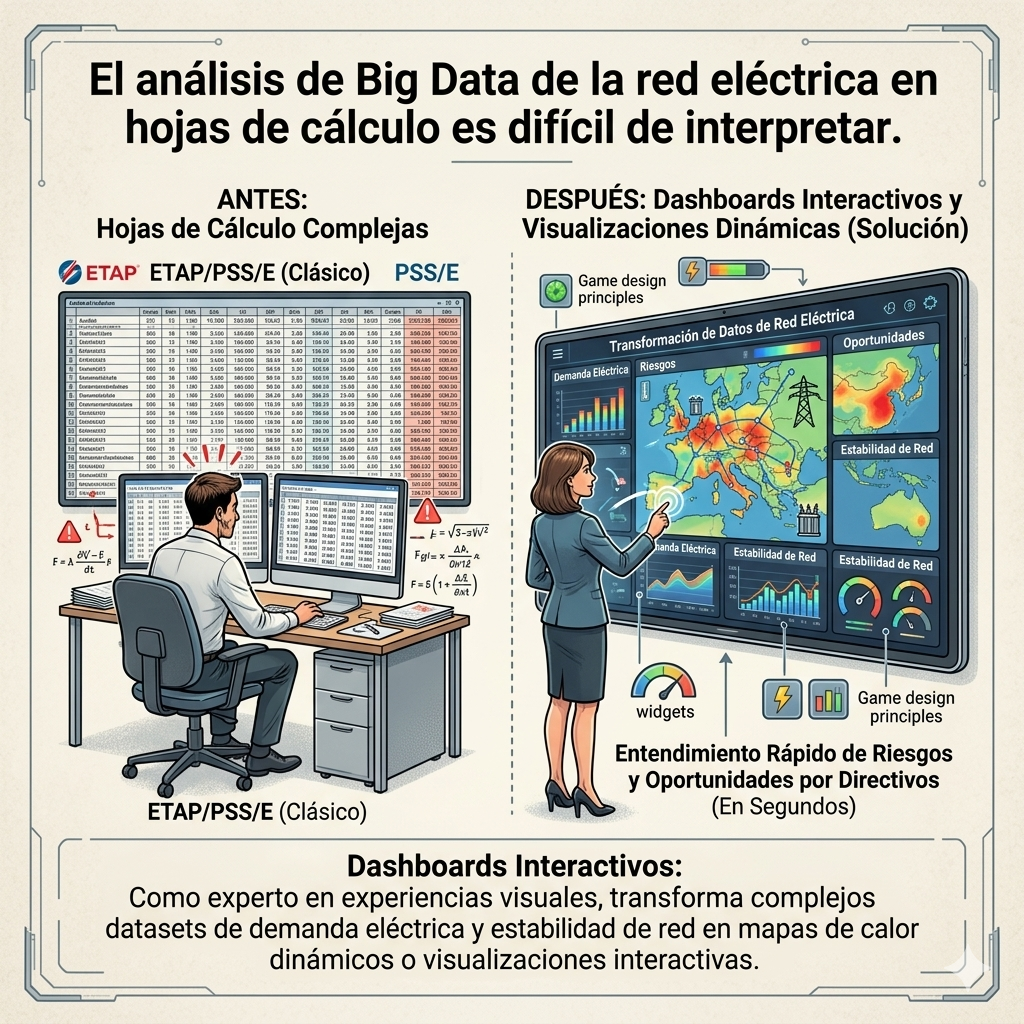
Analyzing large volumes of data (Big Data) from the electrical grid is difficult to interpret in spreadsheets.
Interactive Dashboards: As an expert in creating visual experiences, you can transform complex datasets of electricity demand and grid stability into dynamic heat maps or interactive visualizations that allow managers to understand risks and opportunities in seconds.